
03.02.2021 / 08:42
Understanding Market Liquidity: Resiliency
Financial Markets

Machine Room Whispers (Part 2)
At first glance, financial markets appear to be becoming more liquid. However, when examined more closely, the increased liquidity often emerges as fickle and fragmented. Now more than ever, it is thus critical to understand an asset’s market liquidity in order to pick the right trading venue, find willing counterparties when they are needed the most and ultimately to control transaction costs. Yet, liquidity is an elusive concept. This short paper will look at a specific dimension of liquidity, resiliency, ways to measure it and give an example utilizing the latest data from Europe’s equity exchanges.
Whereas the liquidity dimensions discussed in the previous paper, tightness, breadth and depth, mainly relay information about liquidity in a normal market environment or on average, resiliency describes the changes in a market’s liquidity in response to events that cause price swings. A market is resilient, if there are many orders to buy and sell a security in response to such price changes. Therefore, resiliency can also be understood as the changes in market depth and breadth during such events. Examples for these events are new information about a financial security becoming public such as an earnings release, a disproportionally large order coming into the market or even a technical problem at an exchange.
One way to examine market resiliency is to evaluate how the limit order book of a financial security evolves throughout these types of events. However, the two measures previously introduced in this series, the touch spread and volume weighted average spread (VWAS), serve as good proxies as well. If the VWAS does not increase materially in response to an event causing price fluctuations, a market’s resiliency is high and vice versa.
Let’s illustrate this concept by comparing the development of the spread of the two biggest stocks in the German DAX, SAP and Siemens, around their most recent earnings release on the two largest trading venues, Xetra and CBOE, for their respective shares.
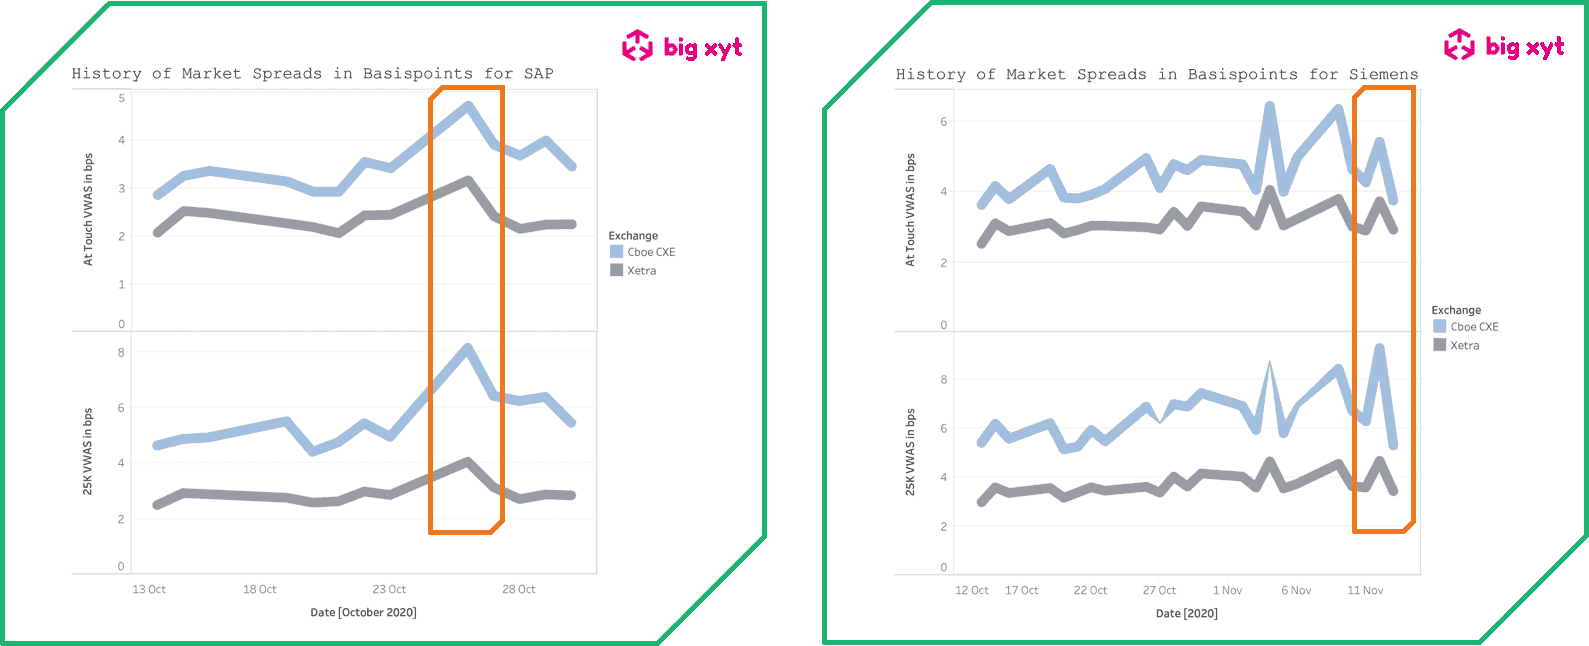
SAP released its Q3 earnings on the 26th of October (highlighted in the upper chart) and disappointed markets by delivering a gloomy earnings outlook due to Covid-19. This clearly had an impact, especially on realised spreads for larger orders on that day. Furthermore, it is noteworthy that the increase in realised spreads is much larger on CBOE than on the primary exchange for SAP, Xetra.
Siemens came public with their Q3 earnings on the 12th of November (highlighted in the bottom chart) and was largely in line with market expectations. Correspondingly, the spike in realised spreads was smaller, and yet still noticeable. Once again, liquidity conditions on the secondary exchange, CBOE, were less resilient to the earnings release.
Institutional investors can get an idea of the resiliency of the markets that they trade in by examining the behaviour of spreads around events that could have an impact on resiliency such as the ones mentioned in this paper. They can then use this information to estimate their transaction costs at times of heightened market volatility and are able to make a more informed choice about which trading venue to select.
The next post in this series will examine the impact of order size on average transaction costs and use it to highlight one of the key differences between lit and dark markets.