
24.02.2026 / 08:30
Renewable Energy for Tomorrow – Some Thoughts on Quantifying Uncertainty in Prediction
Energy Markets

The rapid and sustained expansion of renewable energy, particularly wind and solar power, presents substantial challenges for the integration into electricity systems. Because wind and solar generation depend on weather conditions, they cannot be easily dispatched on demand. This intermittency introduces uncertainty into the energy system, requiring continuous balancing of supply and demand. Unexpected production deficits lead to higher-cost compensation from flexible conventional generators, while excess renewable supply results in curtailment and negative prices.

Short-term renewable generation forecasts, over intraday to multiday-ahead horizons, help reduce uncertainty about future renewable production. These forecasts enable more efficient reserve allocation, reduce reliance on conventional plants held in standby, improve unit commitment and economic dispatch decisions, and support grid stability by allowing operators to better plan for fluctuations in net load. They also help energy market participants to pursue more optimal trading strategies.
In recent years, numerous data-driven techniques, including machine learning models, have improved the accuracy of renewable energy forecasts. However, due to the inherently unpredictable nature of weather, forecasts are never exact. Point forecasts, as single-valued estimates of future outcomes, fail to capture the range of plausible realizations. In contrast, probabilistic forecasts deliver a predictive distribution, quantifying both expected outcomes and their associated uncertainty, thereby supporting risk-aware decision-making in power system operations.
In renewable energy, uncertainty emerges from multiple sources and layers, which can be captured through probabilistic forecasts in several ways.
One approach is to introduce uncertainty through the inputs, for example, by generating multiple meteorological scenarios, assigning each a probability, and feeding them into a point forecasting model. The resulting ensemble of forecasts forms a distribution that reflects uncertainty in the inputs.
Alternative approaches capture model-based uncertainty, which is uncertainty in the relationship learned from the data, either through probabilistic model construction or through post-processing of point forecasts. Common examples of the former include Bayesian models and quantile regression methods, which directly issue distributional outputs. We provide an example of this approach by probabilistically forecasting wind and solar power production using Bayesian inference (The basis of our example is data from the Atacama Region in Chile, with the location of renewable power plants shown in Figure 2).
A core characteristic of renewable energy data is its diurnal and seasonal pattern. To capture this structure, each day’s 24-hourly power measurements are treated as a single unit of observation. Rather than modeling the full 24-dimensional vector directly, each trajectory is represented through a small set of latent factors extracted through principal component analysis.
In other words, the 24-hourly measurements are embedded into a lower-dimensional space. The latent factors in the embedding space summarize the dominant patterns that govern both the shape and the variability of the daily power curves, providing a compact yet highly interpretable basis for forecasting. The same technique is applied to weather forecasts. Formally, the model corresponds to a dynamic factor model. In simple terms, the complex diurnal and seasonal dependencies of wind, solar, and weather are modelled in low-dimensional latent spaces, and Bayesian estimation allows to extract probabilistic forecasts (details are provided in the recent master’s thesis of the first author1).
An exemplary distributional forecast for multiple wind power plants in Chile is given in Figure 1. The solid black line is the observed power generation. The green ribbons represent the prediction intervals constructed using the empirical quantiles from the posterior draws. Prediction intervals are reported at nominal levels of 20%, 40%, 60%, and 80%, corresponding to the expected coverage probability, which is the probability with which the observed value is expected to lie within the interval.
Ideally, probabilistic forecasts achieve this coverage in practice, while adjusting interval width to reflect the uncertainty of individual predictions, widening under volatile conditions and narrowing when forecasts are more certain. For wind and solar power generation, this reflects weather-driven variability across the diurnal cycle.
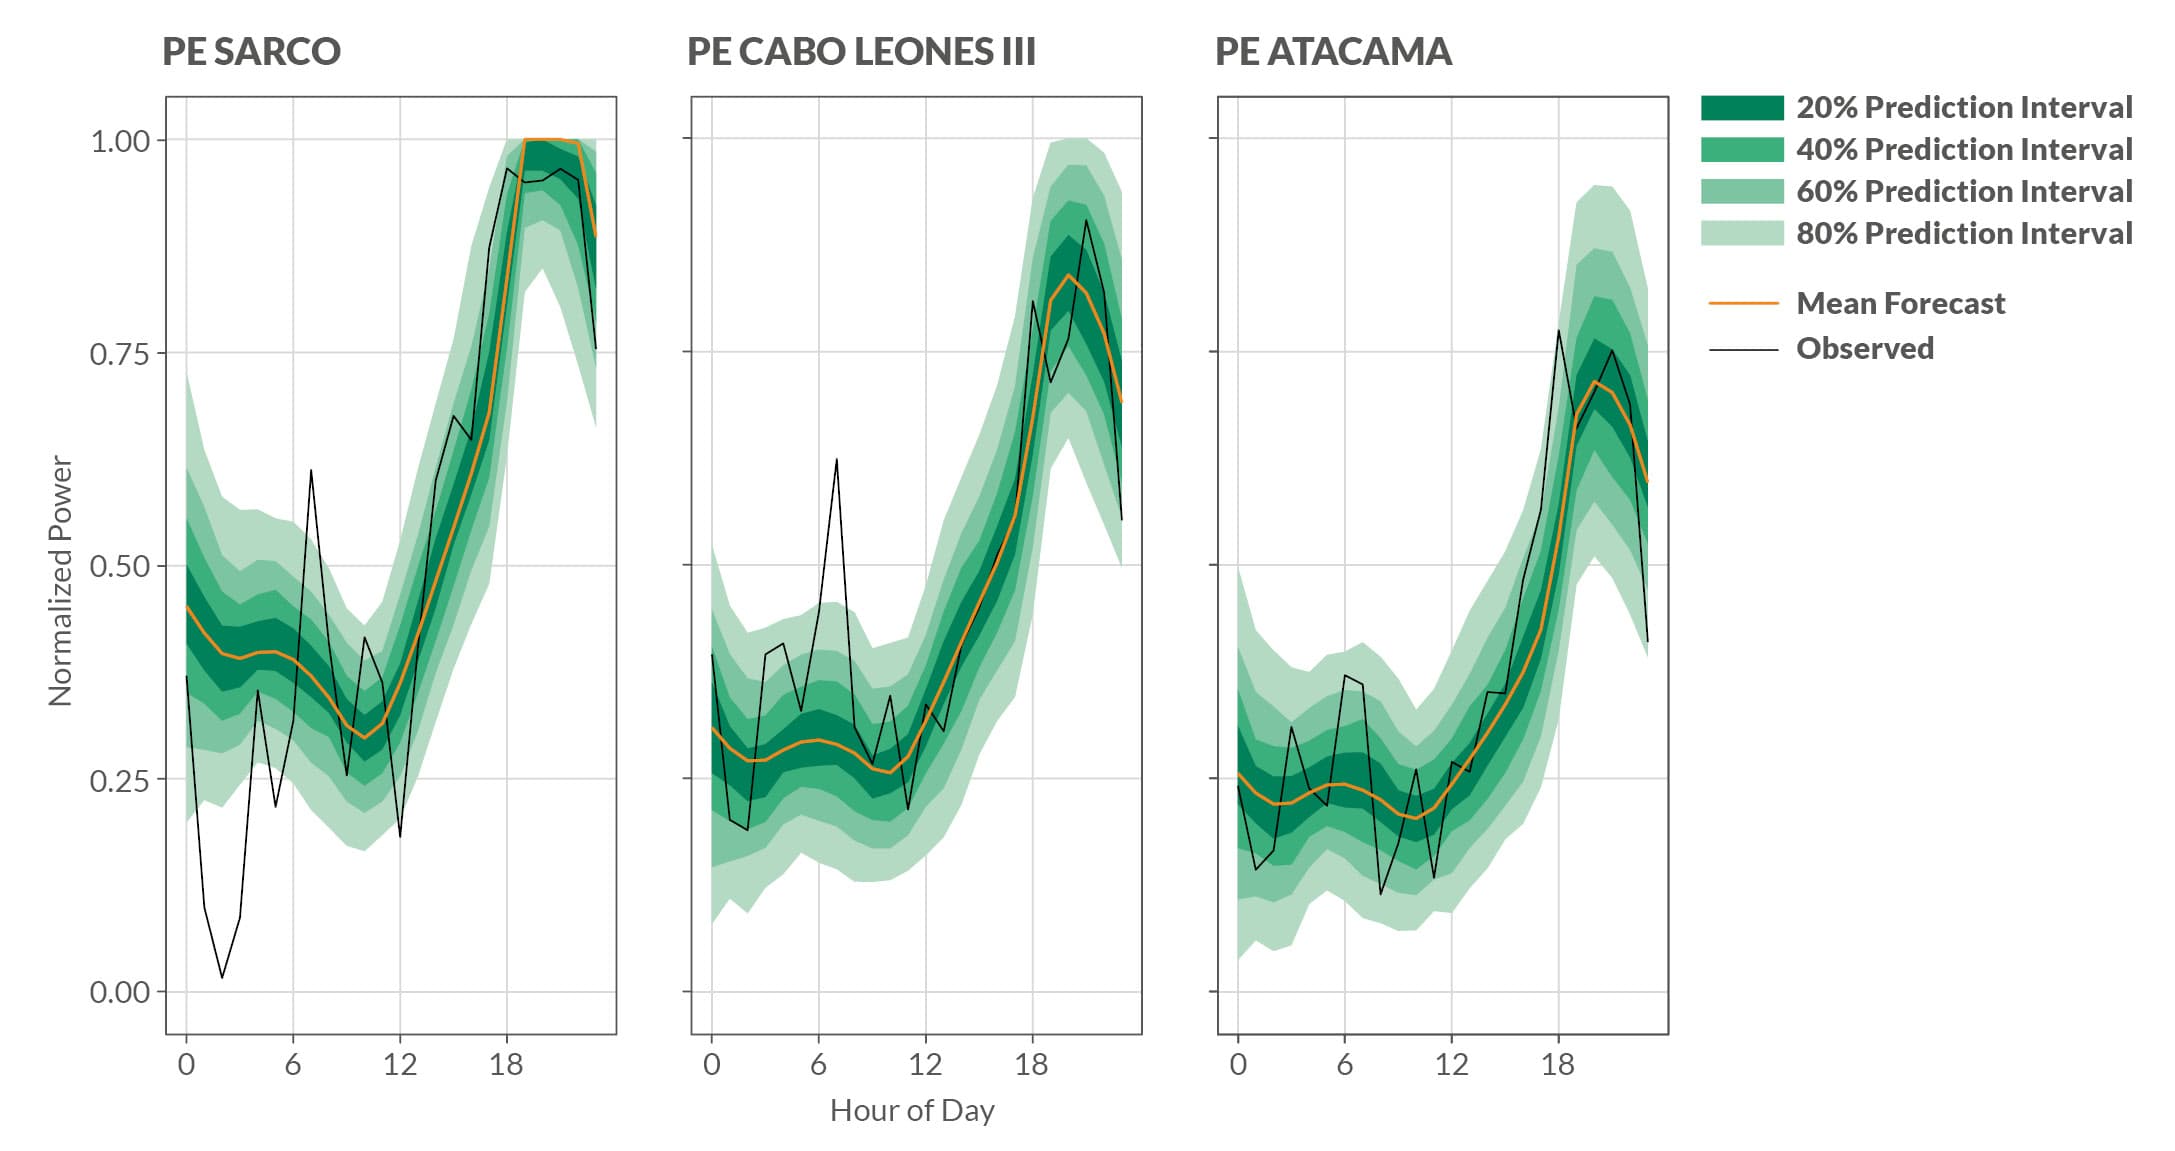
Figure 1: Probabilistic Power Forecasts for Selected Solar Assets
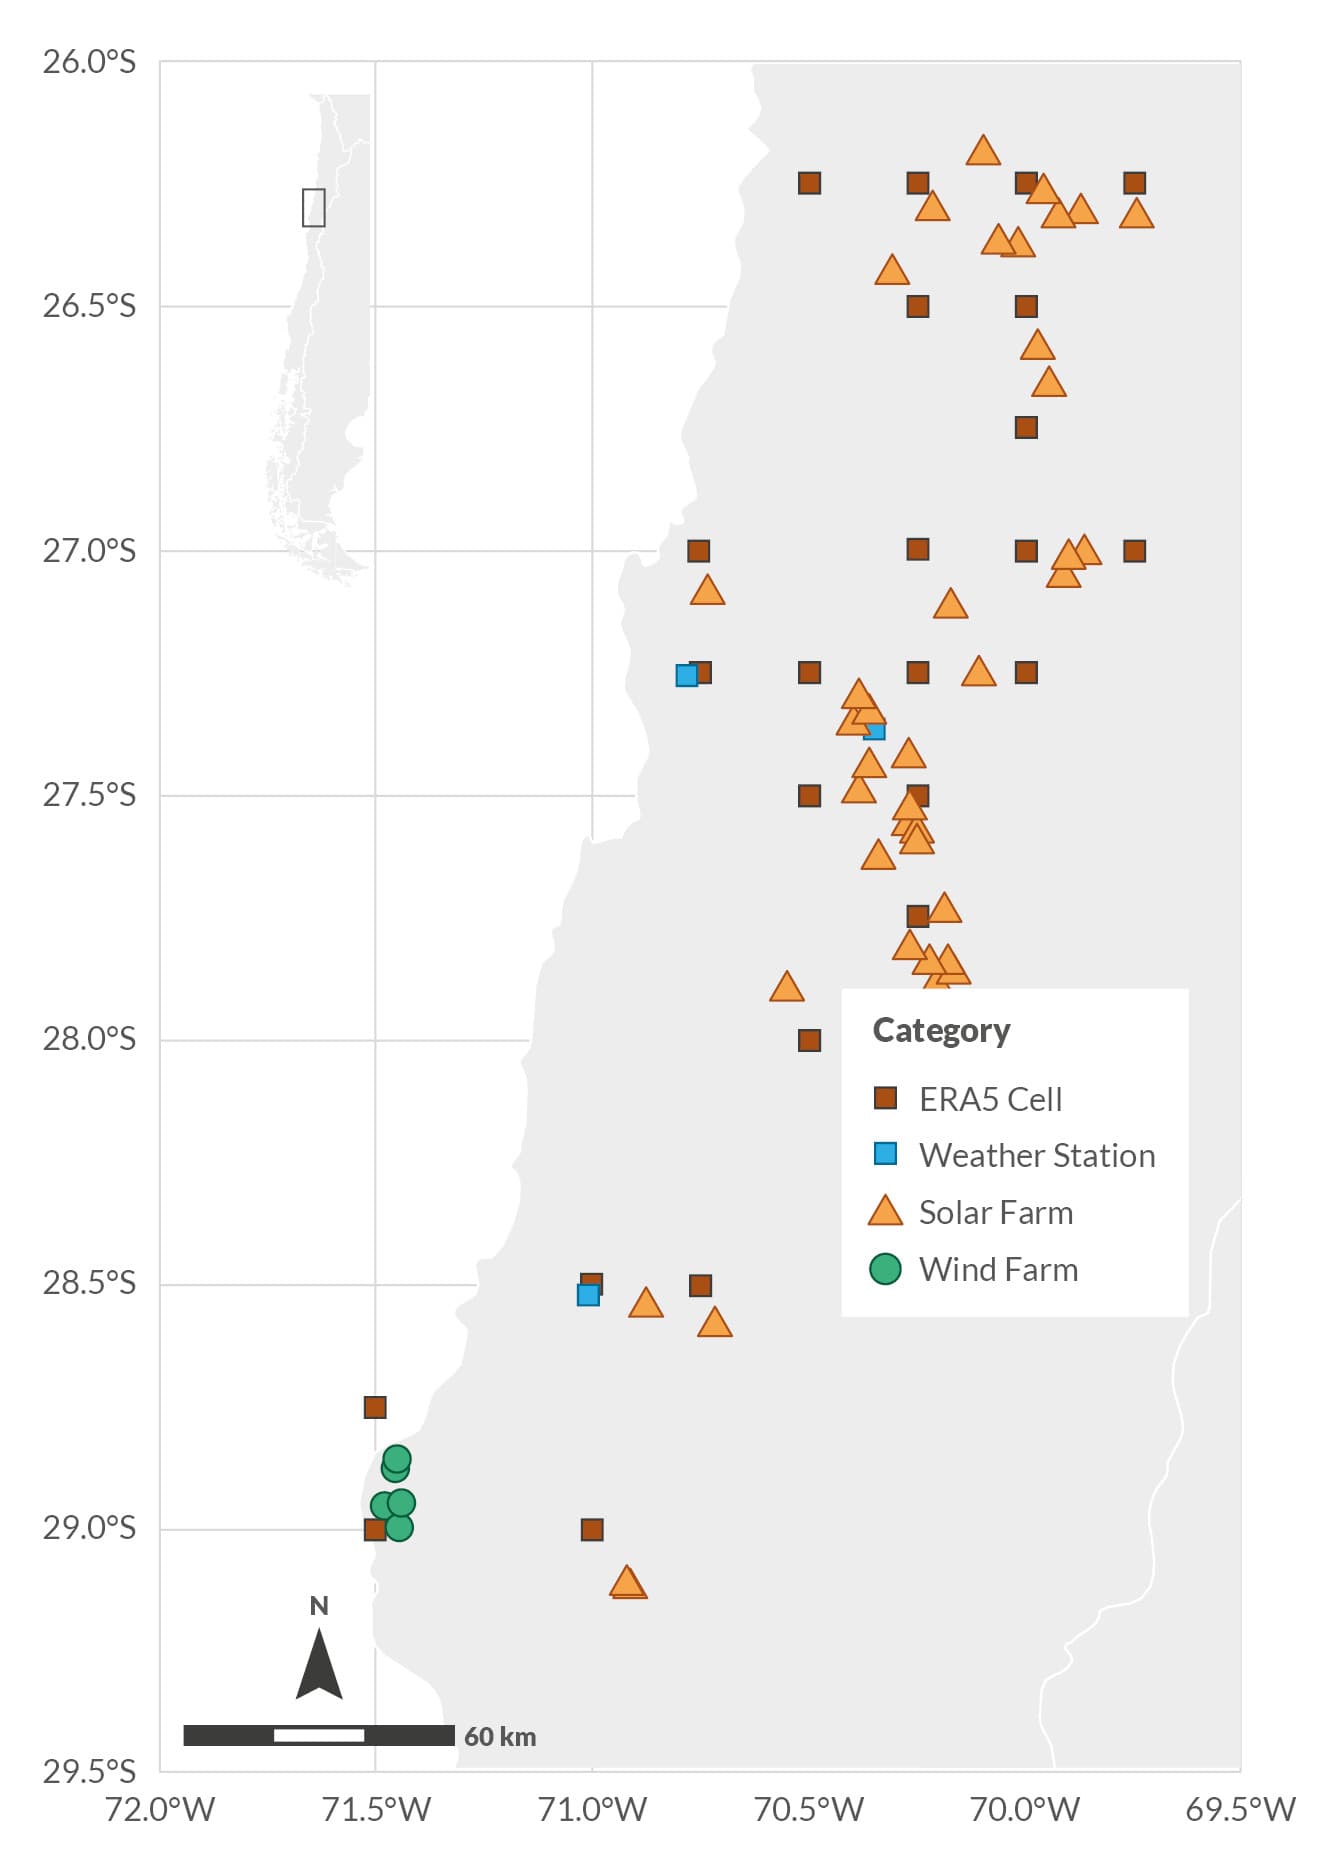
Figure 2: Spatial Distribution of Renewable Assets and Weather Data in Northern Chile